
Introducing polls feature on The Student Room
User retention
.
User engagement
.
Drives conversation
.
Low effort, high interaction
.
Habit loops
.
Strengthens personalisation
.
Creates curiosity loops
.
User retention . User engagement . Drives conversation . Low effort, high interaction . Habit loops . Strengthens personalisation . Creates curiosity loops .
Brief/Problem statement
User analytics revealed that over 40% of visitors were passive, with low contribution rates and limited incentive to return. This lack of engagement directly impacted key business goals around retention, community growth, and user-generated content. Users expressed a desire to participate in low-effort ways, stay informed about community opinions, and feel their input mattered—yet the current experience didn’t support lightweight interaction or reasons to revisit the platform. A solution was needed that would reduce friction, increase active participation, and drive repeat visits while aligning with business targets for engagement and retention.
Overview
Target audience
The Student Room's target audience are young people aged 14-24 who are either preparing for, attending, or have recently finished university, including students from GCSE level through to undergraduate and postgraduate levels. This broad group includes students seeking information, guidance, and peer support for educational, financial, and lifestyle decisions related to their student journey.

These are the different stages of a user goes through, not every member goes through these stages, some members are active from the beginning and drive most of the conversations, but a vast majority aren’t that active, and need some kind of push or trigger to start interacting.
User research discovery
To understand why users were not engaging beyond passive browsing, a mix of qualitative and quantitative research methods were used, including surveys, in-platform analytics, user interviews, and heat map tracking. Key insights emerged across four themes:
Low-Effort Engagement Was Missing
58% of surveyed users said they wanted ways to “participate without having to write a post or comment.”
Interview participants expressed hesitation about “saying the wrong thing” or “not having enough to contribute,” which stopped them from engaging.
Desire for Community Connection and Validation
Users wanted to feel part of a conversation without the pressure of long-form responses.
Many said they enjoyed seeing differing perspectives but had “no quick way to add their voice.”
Understanding polls in depth
Polls single select
Anonymous polls: Only poll creator can see the number of votes.
Non anonymous polls: Everyone can see the number votes.
Curiosity and Participation Didn’t Have a Hook
65% of users reported they would be more likely to return to the platform if they could see “what others think about a topic” or track opinions over time.
Click heatmaps showed users scrolling through threads without interacting, indicating interest but low activation.
Engagement Drop-Off Was Tied to Effort and Feedback Loops
Data showed that first-time users who didn’t interact in any way were 40% less likely to return within a week.
Users who voted in existing feedback widgets or rating prompts returned at nearly double the rate of those who didn’t.
Key insight
Users were willing to engage—but only if the interaction required minimal effort, offered immediate feedback or visible results, and connected them to the community without pressure. This validated the need for lightweight, curiosity-driven features like polls to bridge the gap between passive consumption and active participation.
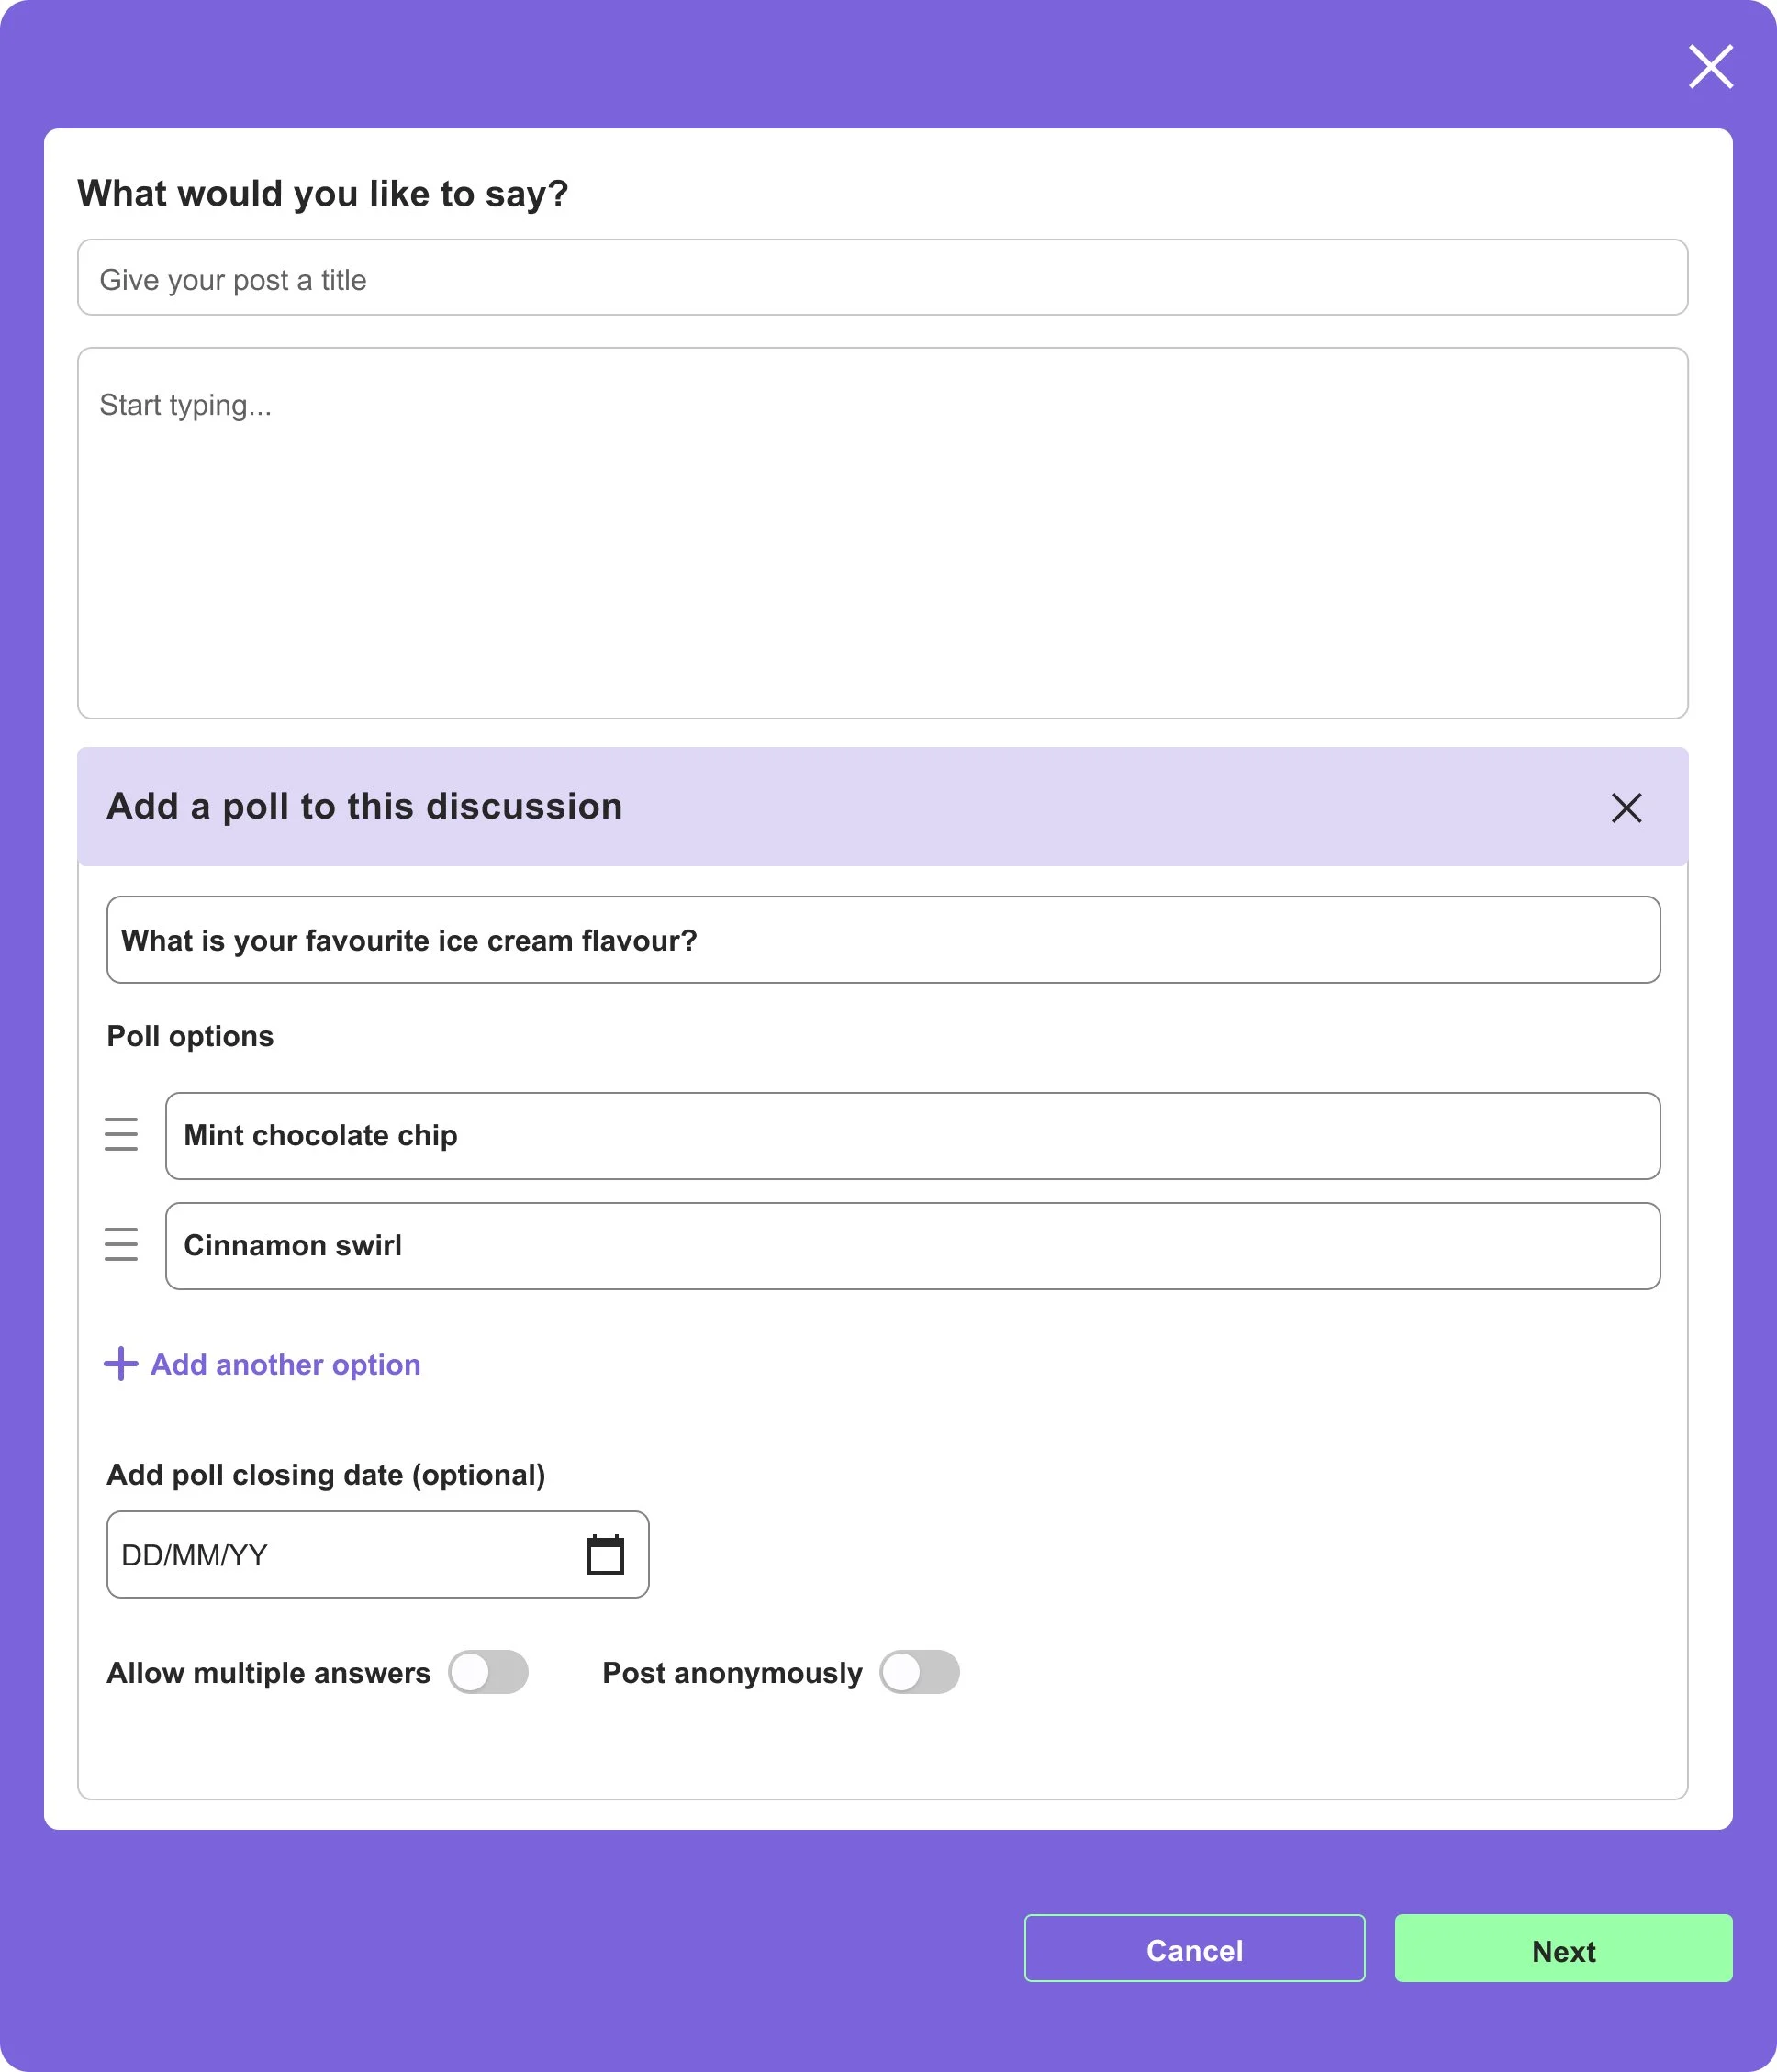
At this stage, an in-depth understanding of polls was done to get the clarity required to design polls.

This information will help decide whether to give certain features to create polls. It is important to design polls that are less prone to errors.
Polls on other platforms: competitive analysis
After laying the foundation, I conducted a competitive analysis to identify the parameters that could be used to create a poll and to understand:
The features that a poll typically includes on different platforms, and what we can add to the solution to make it relevant to our context.
The common process of creating and participating in a poll.
The platforms analysed include Facebook, Telegram, Discord, Mighty Network, Twitter, and others.

As we can see there is no common flow or pattern here, they have a lot of similarities and dissimilarities.
Based on this analysis I have decided on the parameters that make sense for our context and based on that the poll feature is designed.
Polls userflow


Polls multi select
Before moving ahead let’s understand what a poll-taking experience should look like: It should be easy to attempt and not overwhelm the user leading them to leave the poll.
Limiting Poll Options
Initially, the idea was to not limit the poll options. However, upon considering the poll-taking experience, I found it better to limit the poll to 10 options. Having too many options can give cognitive load to the user and lead to an overwhelming experience.
Anonymous votes
People might be conscious about voting for selecting certain options so to avoid we can give a choice to make the poll anonymous (Solves Responsive bias).
Multiple Answers
It is a good feature to have because in some cases more than one answer is needed.
Poll duration
To ensure accurate results and avoid skewed outcomes due to continuous voting it is necessary to limit the duration of the poll.
After posting the poll
Here we will see all the options available to the user after posting the poll
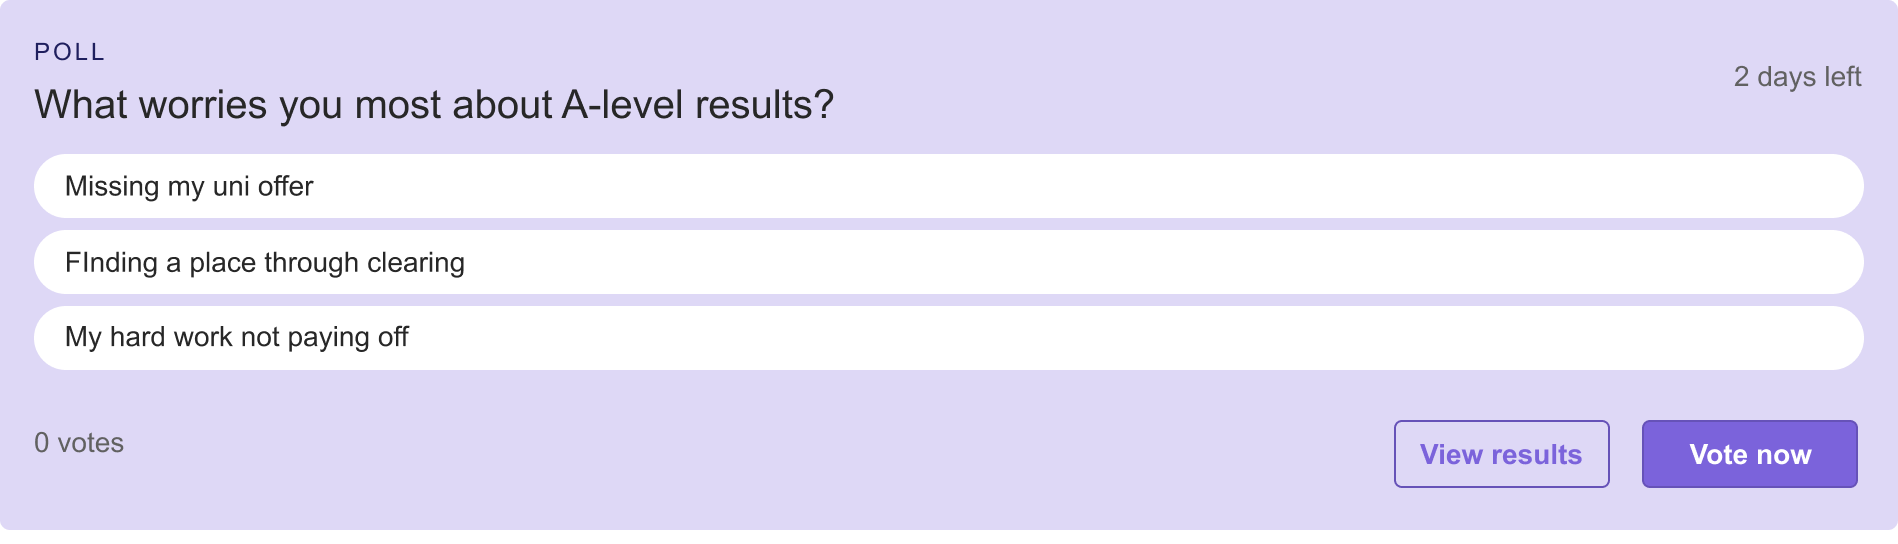
Poll poster can see the results without voting

Indication of time left before poll closes
A vote now button
User testing
1 round
One round of Prototype testing held, externally and designs were iterated according to the findings.
About user testing session
Test group was a good mix of participants that are active users, lurkers, first time visitors, community members.
Moderated testing session + follow up interviews. (Cannot include any images or test session links as all the participants were aged below 18.)
Scenarios included: Voting, creating a poll, viewing results.
Overall usability score - 74/100
Task completion scores
Voting was effortless. However, most of the participants had a suggestion around adding image poll feature which was taken into consideration but stake holders suggested we release the feature with text poll first and then follow up with image poll.
Top positive indicators.
Fast interaction
Zero cognitive load for voting
Strong motivation to re-engage
Aligns with lurker behaviour
Works well on mobile
Final assessment
The poll feature scored high on usability, engagement intent, and task success, making it a strong solution for activating passive users and improving retention. With light refinements to clarity and follow-up feature, polls was ready for wider rollout.
The feature increased return visits by up to 30% and doubled engagement in key communities.
Post rollout
The feature increased return visits by up to 30% and doubled engagement in key communities.